A Swiss Knife Function that if you know can help to solve different problems.
By default the input is based on array of number.
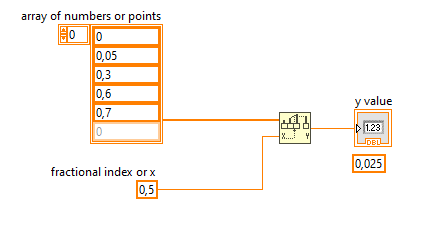
The array is intended as a points where the x is the index value of the array, then the output is the Y at x value where the x array is intended as min index and max index of the array.
But this function can take also an array of points in input (array of cluster (x;y).
Then we can use array of cluster to use with arbitrary x and y points array.
Some example of use:
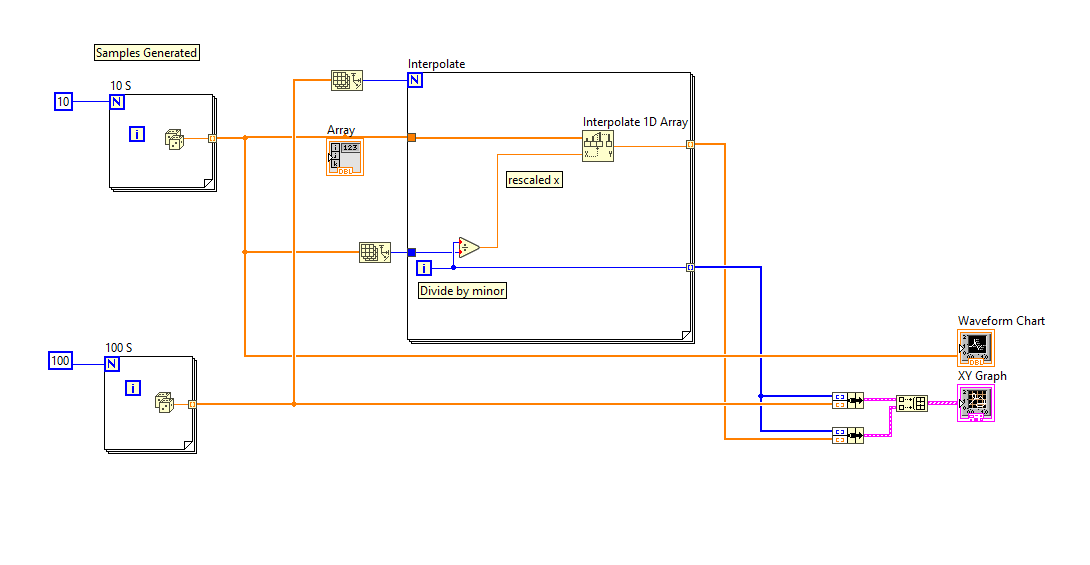
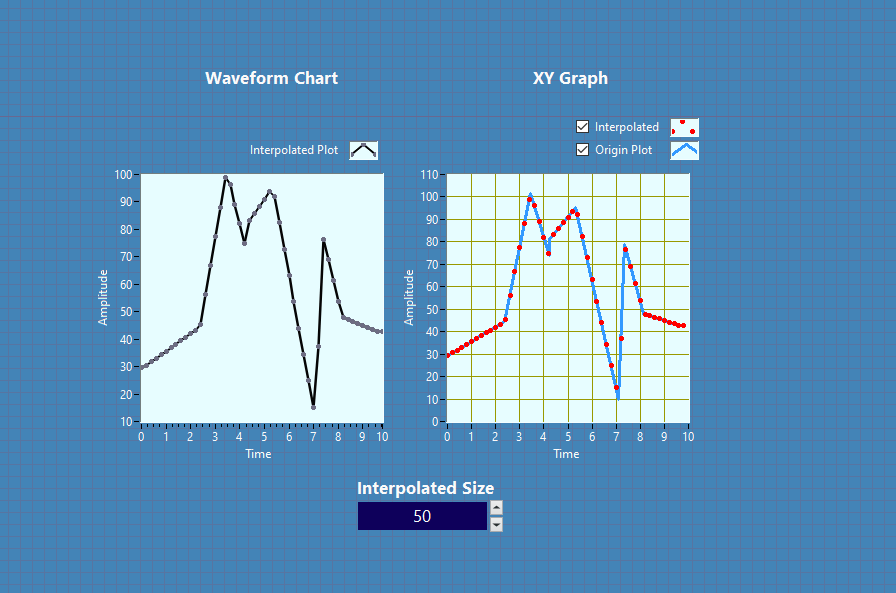
Convert XY Graph in a Waveform Chart
The XY Graph have arbitrary x axes values, the chart have only Y arbitraries values because X is defined by index of a 1D array.
WIth the Interpolate 1D array.vi
basic function can help us to resolve this.
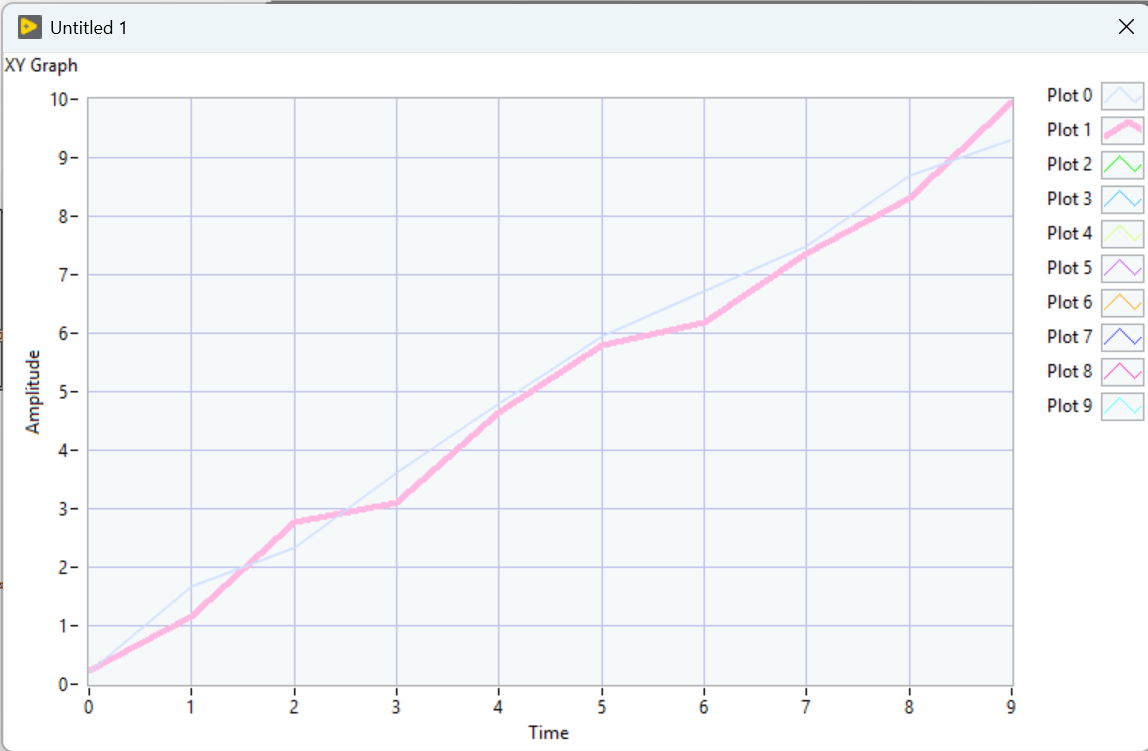
And this is the results
This VI is Linear Interpolate, if you need different method try the Interpolate1d.vi or searcho for the other interpolation functions on the math palette.
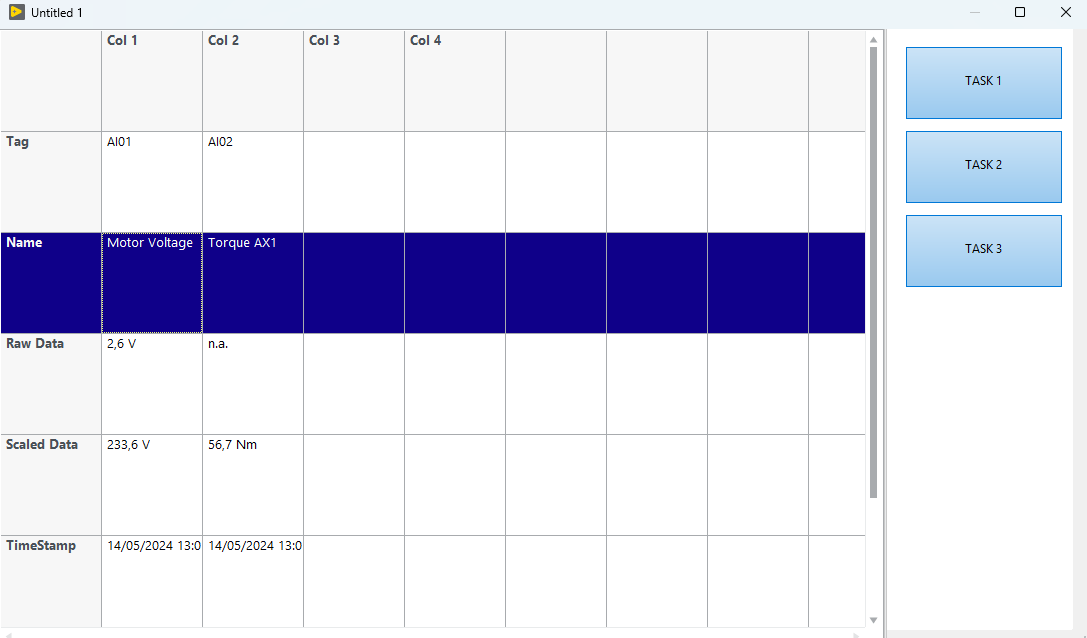
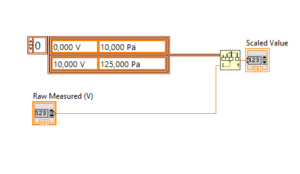
Rescale raw data
The array input accept array of number (y) or array of point where point (x;y).
Then you can use a list of point (i.e. define the point min and max for linear scale, where x is the raw data and y is the scaled value). Add more point to define a table scale.

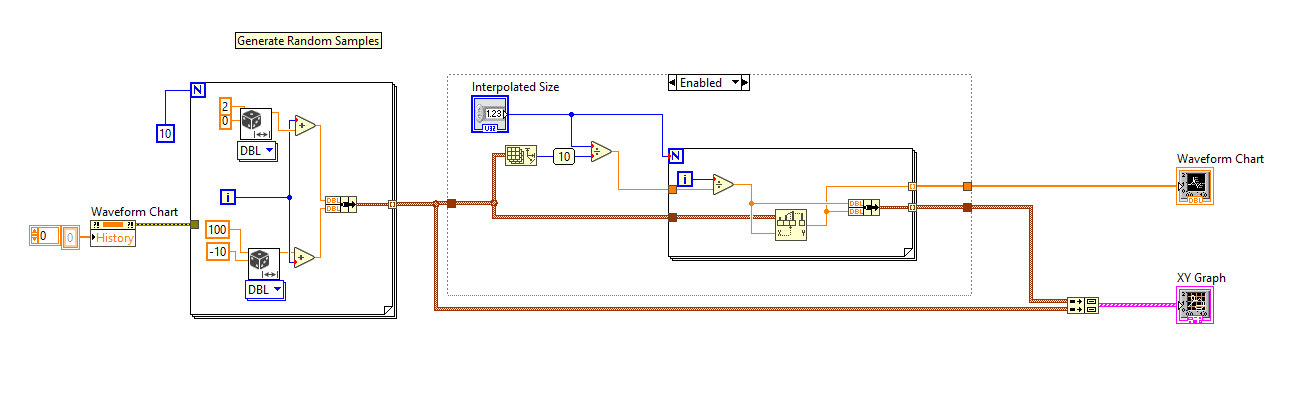
Interpolate Different Buffer acquired
Each 1s i get two array of measures with different acquisition time, then i have one of 10 and one of 100.